Decision Tree Javascript For Quiz Application
This Page Contains information about Decision Tree Javascript For Quiz Application By jackson in category Javascipt with 0 Replies. [5128], Last Updated: Mon Jun 24, 2024
jackson
Sun May 28, 2023
0 Comments
1897 Visits
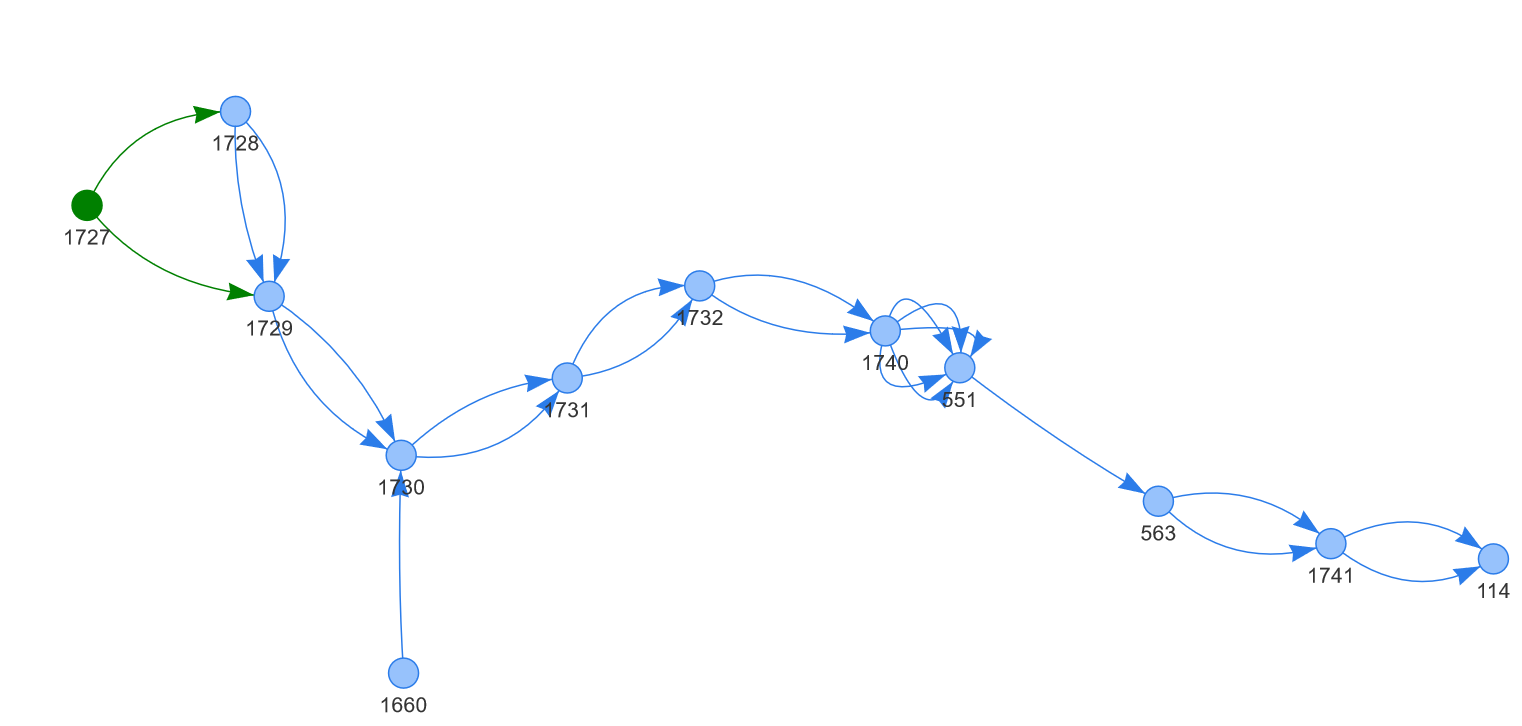
Decision Tree Map
You can use this handy application for decision tree javascript from github to display an visual represnetaion of the decision path for a quiz application.
https://github.com/almende/vis
This project is not maintained anymore! Please go to https://github.com/visjs
It works for me.
Here an an example quiz data:
<div id="mynetwork"></div>
<script type="text/javascript">
 // create an array with nodes


   var nodes = new vis.DataSet([
   {id: 1727, label: '1727', title: 'Have you traveled recently to any Asian country? [START]', color:'green'},
			{id: 114, label: '114', title: 'Have you seen a doctor about your problem?'},
			{id: 551, label: '551', title: 'What is your age?'},
			{id: 563, label: '563', title: 'What is your gender?'},
			{id: 1660, label: '1660', title: 'Please describe your symptoms.'},
			{id: 1728, label: '1728', title: 'Have you traveled recently to China?'},
			{id: 1729, label: '1729', title: 'Have you been in contact with any person who has recently traveled outside the country?'},
			{id: 1730, label: '1730', title: 'Corona Virus Symptoms may appear 2-14 days after exposure. Do you have fever?'},
			{id: 1731, label: '1731', title: 'Do you have a cough?'},
			{id: 1732, label: '1732', title: 'Do you have shortness of breath?'},
			{id: 1740, label: '1740', title: 'Do you have any of these gastrointestinal symptoms? '},
			{id: 1741, label: '1741', title: 'Have you recently lost your sense of taste or sense of smell?'},
			   ]);

  // create an array with edges
  var edges = new vis.DataSet([
 {from: 114, to: 0, arrows:'to'},
		{from: 114, to: 0, arrows:'to'},
		{from: 551, to: 563, arrows:'to'},
		{from: 563, to: 1741, arrows:'to'},
		{from: 563, to: 1741, arrows:'to'},
		{from: 1660, to: 1730, arrows:'to'},
		{from: 1727, to: 1728, arrows:'to'},
		{from: 1727, to: 1729, arrows:'to'},
		{from: 1728, to: 1729, arrows:'to'},
		{from: 1728, to: 1729, arrows:'to'},
		{from: 1729, to: 1730, arrows:'to'},
		{from: 1729, to: 1730, arrows:'to'},
		{from: 1730, to: 1731, arrows:'to'},
		{from: 1730, to: 1731, arrows:'to'},
		{from: 1731, to: 1732, arrows:'to'},
		{from: 1731, to: 1732, arrows:'to'},
		{from: 1732, to: 1740, arrows:'to'},
		{from: 1732, to: 1740, arrows:'to'},
		{from: 1740, to: 551, arrows:'to'},
		{from: 1740, to: 551, arrows:'to'},
		{from: 1740, to: 551, arrows:'to'},
		{from: 1740, to: 551, arrows:'to'},
		{from: 1740, to: 551, arrows:'to'},
		{from: 1741, to: 114, arrows:'to'},
		{from: 1741, to: 114, arrows:'to'},
		  ]);

  // create a network
  var container = document.getElementById('mynetwork');
  var data = {
    nodes: nodes,
    edges: edges
  };
    var options = {
    nodes : {
      shape: 'dot',
      size: 10
    }
  };
  var network = new vis.Network(container, data, options);
</script>